

SPY Technical Analysis for Monday August 14, 2023
SPY Technical Analysis for Monday August 14, 2023
Unlock ES and NQ Weekly and Daily Analysis as Bonus Charts – Exclusive Insights for Paid Members!

Consumer Inflation Expectations Fall, Producer Prices Rise; A Mixed Economic Picture Emerges

The stock market wavered on Friday as leading technology stocks fell, and economic indicators provided mixed signals. Bond yields saw a rise.
In a fluctuating session, the S&P 500 closed slightly down. The Nasdaq 100 continued its longest weekly loss of the year, lingering near 15,000 points, a level it last dipped below in June. Nvidia, tripling in value since 2023, witnessed a near 10% decline over four days. Conversely, the Dow Jones edged up.
Economic data on Friday left market expectations largely untouched. Most traders anticipate the Federal Reserve to halt interest-rate increases next month, holding off on claiming success in the fight against inflation.
Unexpectedly, consumer inflation expectations dropped in early August despite a rise in petrol and grocery prices, reports the University of Michigan. On the other hand, producer prices increased more than forecast last month, largely driven by specific service sectors.1
SPY Sweeps Prior Day Low at 444.70, Bounces at 443.30 - 443.80, Sweeps Prior Day Close at 445.91


Quiet Economic Day on August 14; U.S. Treasury to Auction 3-Month, 6-Month Bills
On Monday, August 14, the economic schedule is relatively quiet, featuring only two key data releases. At 11:30, the U.S. Treasury will conduct auctions for both 3-month and 6-month bills. The 3-month bill auction is slated to carry an interest rate of 5.29%, while the 6-month bill auction is expected to be slightly lower at 5.26%. Although not accompanied by other significant economic announcements, market participants interested in short-term government securities will likely observe these auctions.2

Latest COT Data for E-MINI S&P 500
(As of August 8, 2023) - Open Interest: 2,221,709, Total Changes: -20,040, Total Traders: 5153
Dealer Intermediaries:
Long positions: 314,024 (+5,833), 14.1% Open Int, 33 Traders.
Short positions: 690,521 (+17,809), 31.1% Open Int, 38 Traders.
Spread positions: 27,741 (-6,221), 1.2% Open Int, 23 Traders.
Sentiment: Bearish sentiment intensifies with increased shorts.
Asset Managers/Institutional Investors:
Long positions: 1,093,720 (-30,851), 49.2% Open Int, 168 Traders.
Short positions: 319,370 (+15,151), 14.4% Open Int, 73 Traders.
Spread positions: 209,786 (-6,795), 9.4% Open Int, 102 Traders.
Sentiment: Bullish sentiment eases, despite increased shorts.
Leveraged Funds:
Long positions: 171,013 (+23,316), 7.7% Open Int, 63 Traders.
Short positions: 498,539 (-31,663), 22.4% Open Int, 95 Traders.
Spread positions: 56,199 (+2,513), 2.5% Open Int, 61 Traders.
Sentiment: Bearish sentiment reduces with decreased shorts.
Other Reportables:
Long positions: 84,662 (-7,732), 3.8% Open Int, 22 Traders.
Short positions: 174,664 (-5,801), 7.9% Open Int, 22 Traders.
Spread positions: 3,363 (+17), 0.2% Open Int, 6 Traders.
Sentiment: Bearish sentiment with decreased longs and reduced shorts.
Nonreportable Positions:
Long positions: 261,201 (-120), 11.8% Open Int.
Short positions: 241,526 (-5,050), 10.9% Open Int.
Sentiment: Neutral sentiment with minor changes in longs and shorts.


Technicals
SPY Weekly
We've fully addressed the weekly fvg range of 444.08 - 449.08 and are watching to see if buyers engage within this range. If the 444.08 level is lost, we might head down to match the equal lows at 437.06. Note a weekly fvg at 430.39 - 432.47. If the bulls clear the 451.55 pivot, they may aim to surpass the week of July 31 high at 458.16.

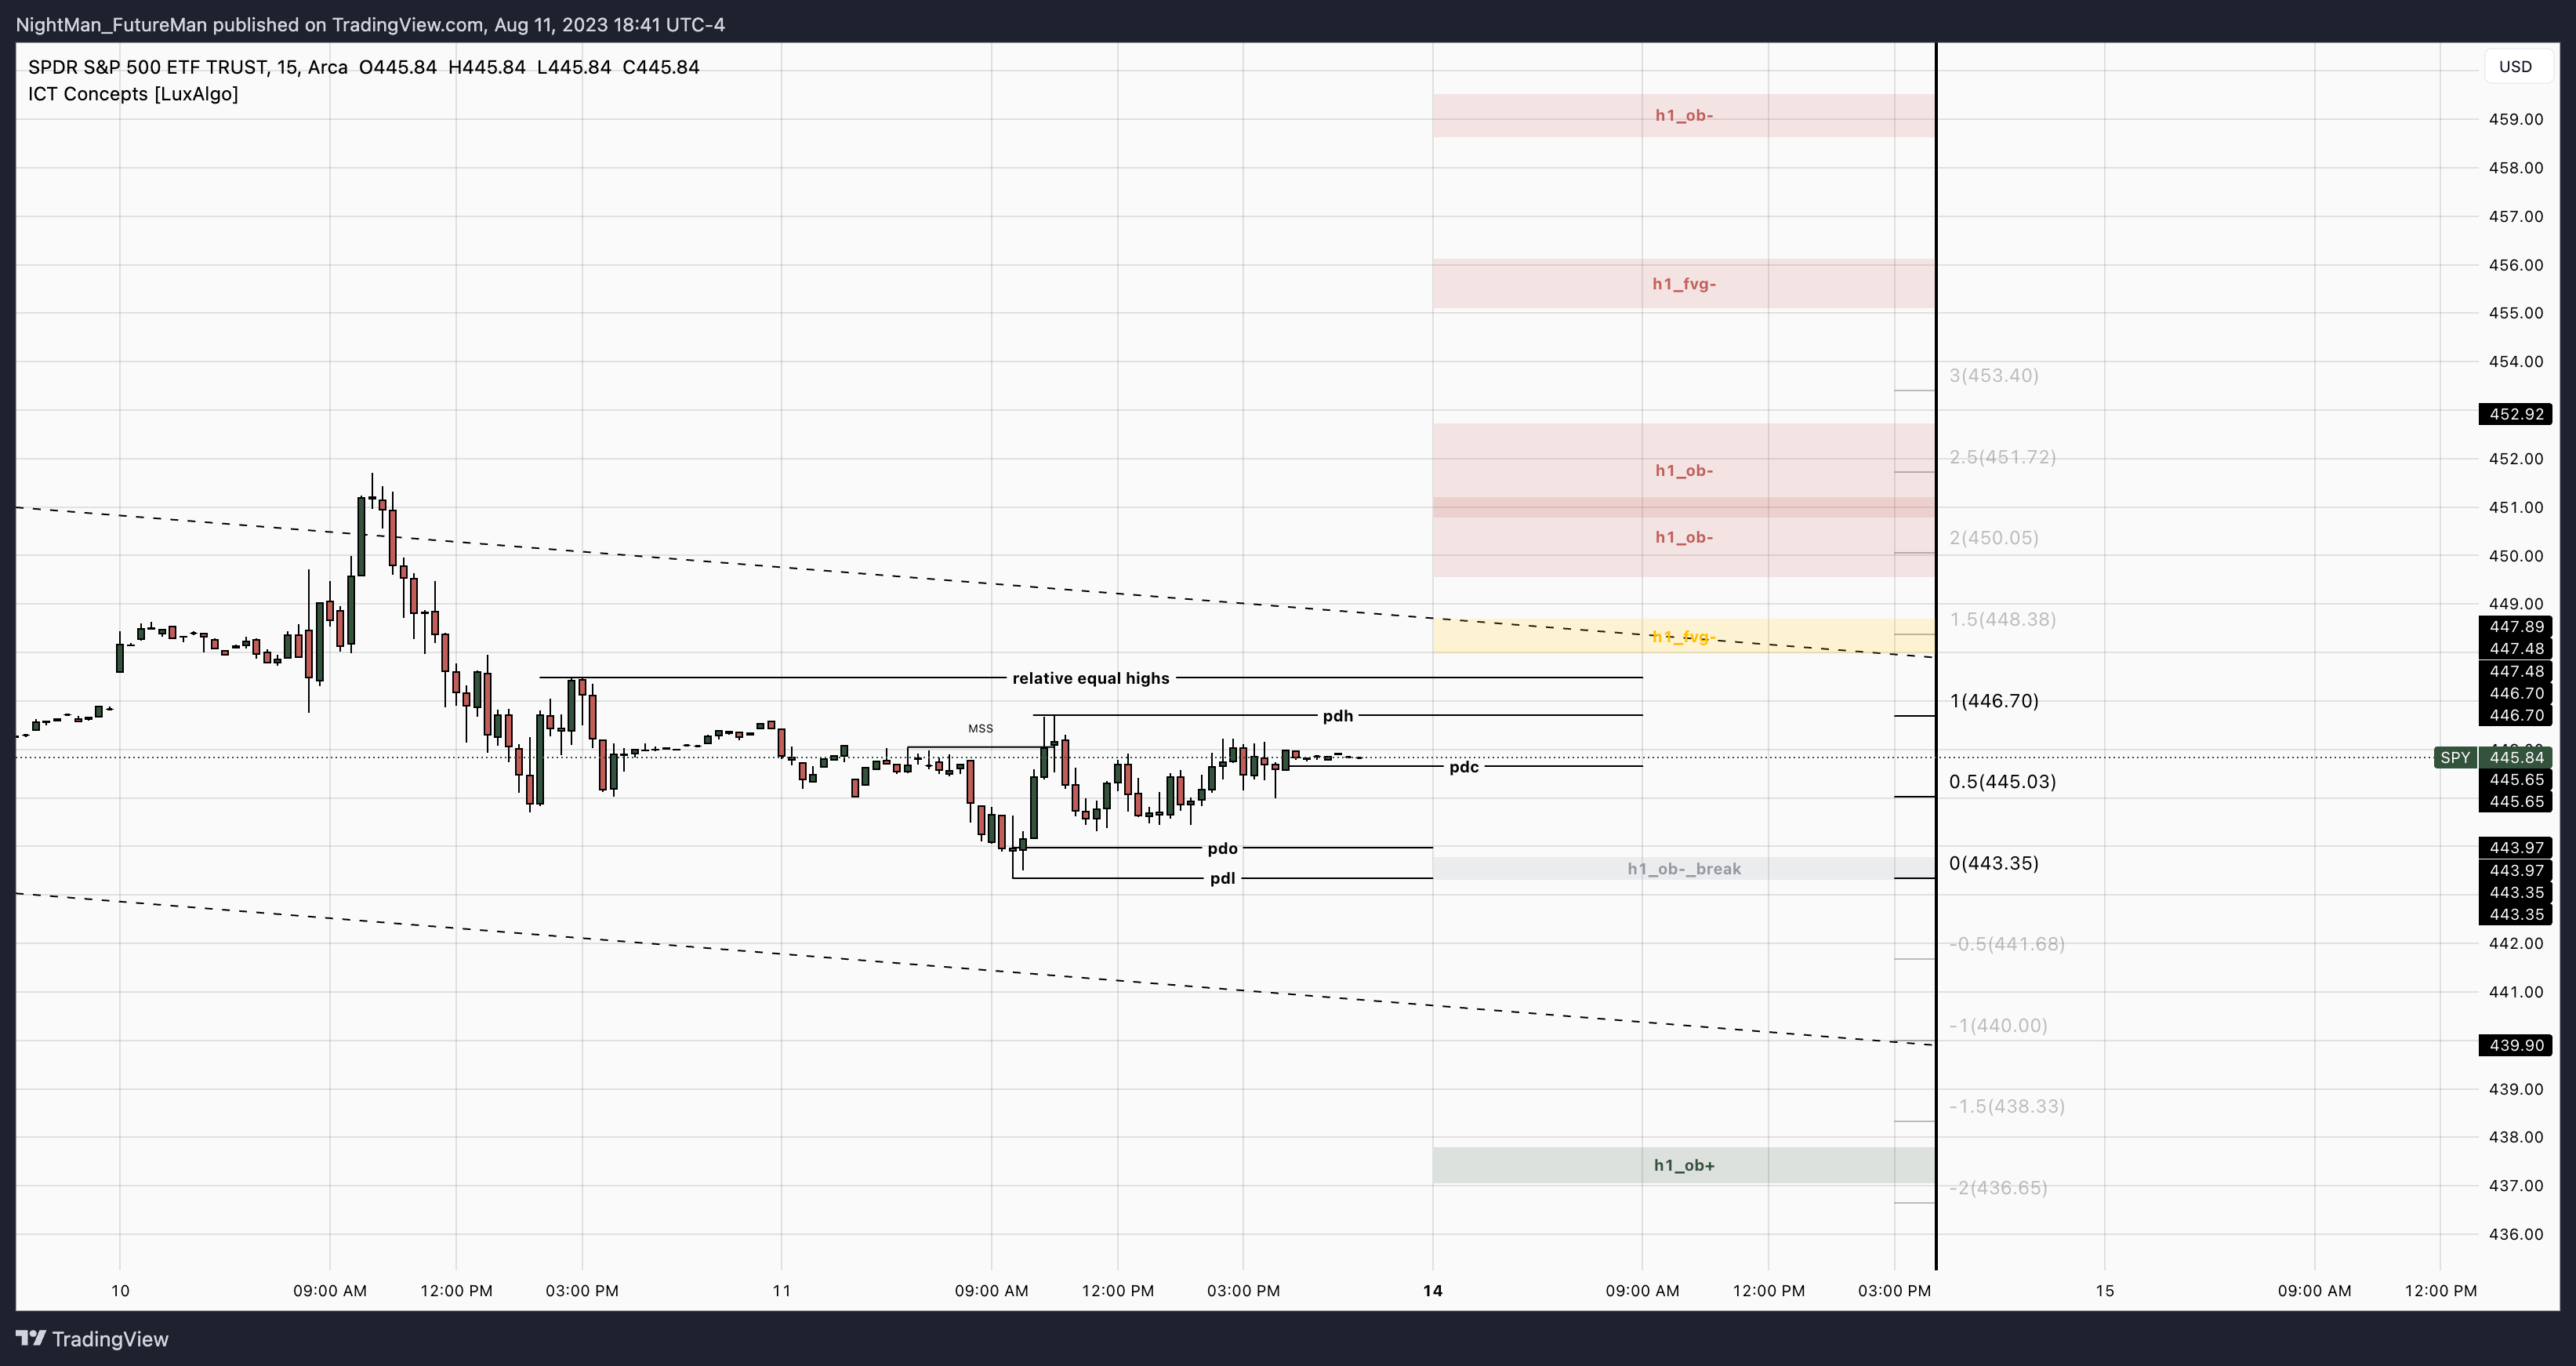
SPY H1

The chart is bearish, but the outlook is neutral at the current price level IMO. The Bulls will aim to protect the range at 443.30 - 443.80. Look to the chart's target standard deviations if this range is lost. There is another point at 437.03 - 437.82 where a reaction might occur.
If the prior day's high of 446.70 and equal highs at 447.48 are cleared, resistance might be found at 447.95 - 448.72. Above this, where reactions may happen, there are overlapping bearish order blocks at 449.54 - 451.22 and 450.77 - 452.74.
The H1 is a tight range. The current H1 range is:
1: 446.70
0.5: 445.83
0: 443.35
Refer to the chart for standard deviations.
Still holding the Range on the RSI as we grind lower.

Bonus Charts
ES1! Weekly
The outlook appears more bearish compared to the SPY weekly. Bears are attempting to reverse the range at 4494.00 - 4528.00. If 4528.00 is cleared, attention will shift to the range of 4544.75 - 4553.75 and the high of the week of July 31st at 4621.75. If this week's low of 4459.00 is lost, the next downside targets will be 4411.25 and 4368.50. It's also worth noting a range of 4297.75 - 4348.75.
Keep reading with a 7-day free trial
Subscribe to Follow the Trend to keep reading this post and get 7 days of free access to the full post archives.