


🕵️♂️ I SPY, QQQ, IWM TA - Thursday Nov. 11, 2021


US Market Wrap - Financial Juice
As a scorching inflation reading roiled financial markets, US stocks plunged the most in a month and bond yields surged higher.
After a 30-year treasury auction yielded greater than expected, the S&P 500 fell 0.8%, extending earlier losses. Two-year yields also jumped as statistics revealed the fastest annual inflation rate since 1990, upending bets on when the Fed will raise rates next.
The Nasdaq 100 led markets lower, as its highly valued tech members are thought to be the most vulnerable to inflation. The dollar reached a 52-week high, oil fell more than 3%, and gold rose.
Stocks and bonds are becoming riskier as persistently high inflation forces the Federal Reserve to taper at a quicker pace or raise interest rates sooner than expected.
The consumer price index in the US jumped 6.2% in October, exceeding predictions of 5.9%.
Yellen restated her belief that high inflation in the US will not last beyond next year, and that the Fed will not accept price increases similar to those seen in the 1970s. Traders are concerned that the recent data may be enough to persuade the Fed to increase rates as soon as June 2022, when it will have completed tapering its asset-purchase programme.
The five-year breakeven rate on government inflation-protected securities in the US hit a new high. In the meantime, the yield on the 10-year US Treasury note rose 13 basis points to 1.56%.
🕵️♂️ I SPY, QQQ, IWM TA - Wednesday Nov. 10, 2021
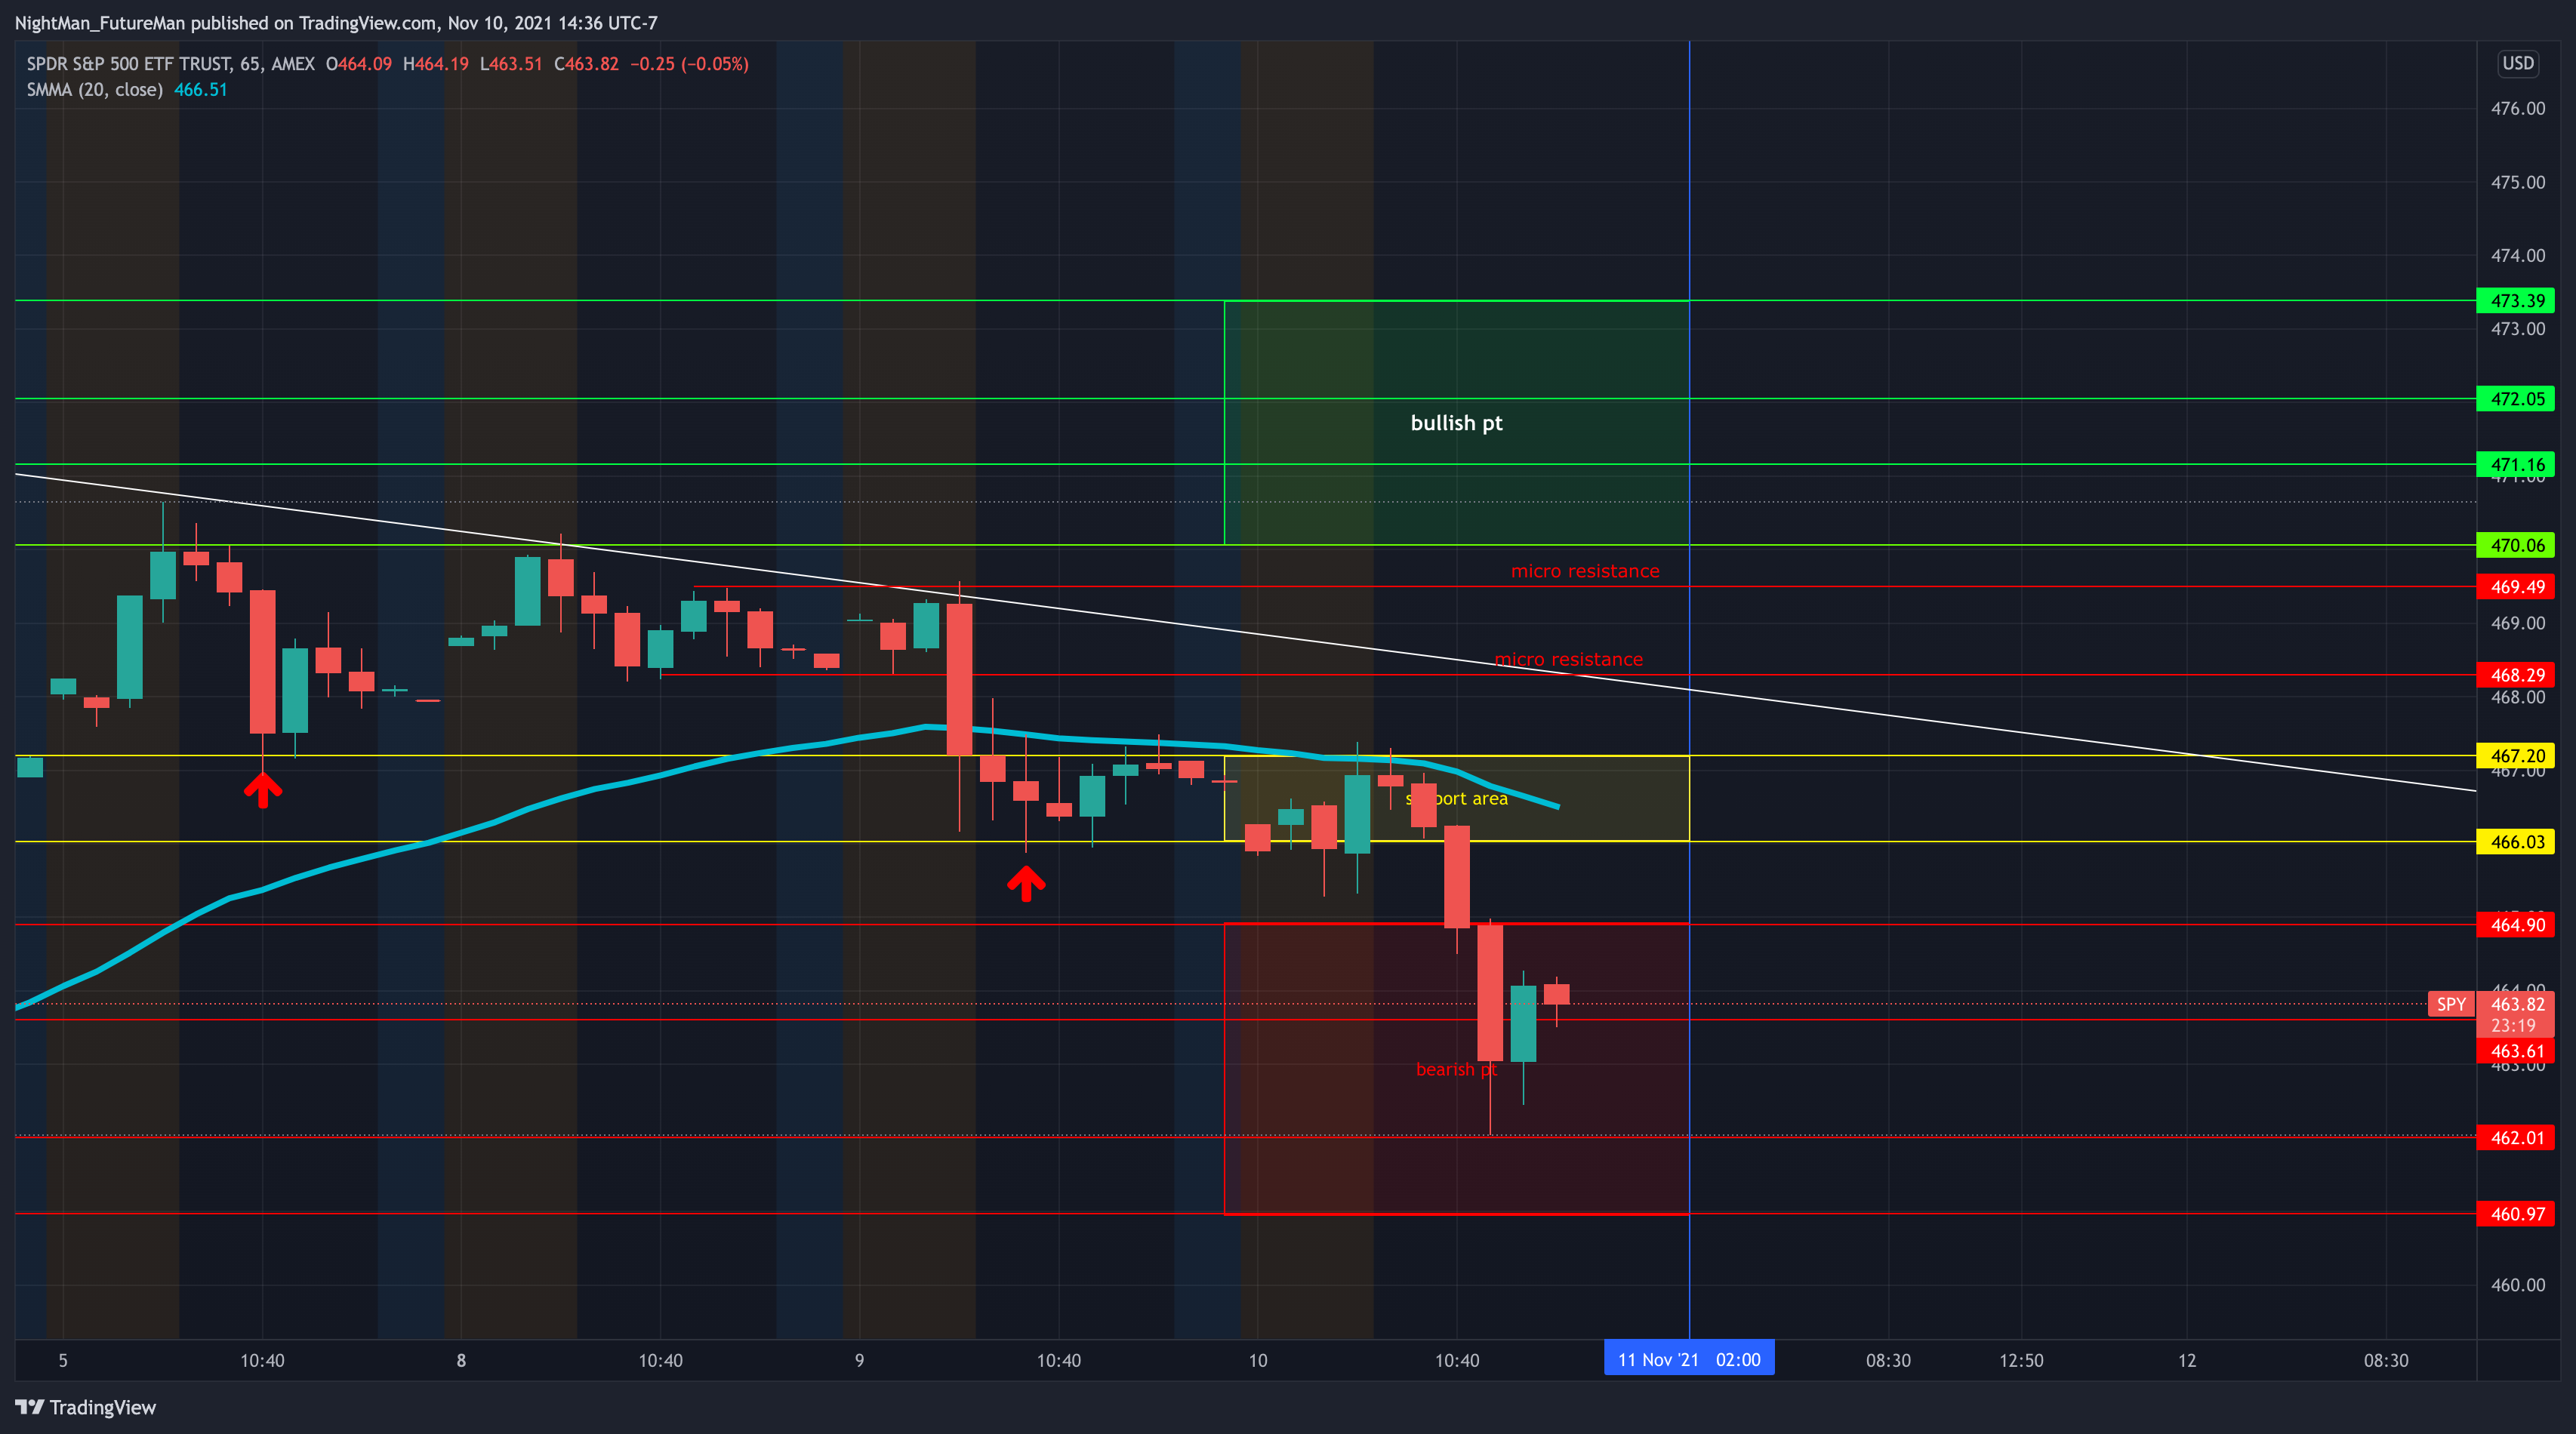
SPY Recap - Nov. 10
Support - 467.20 - 466.03
🔎 resistance - 468.29, 469.49
🐂 🎯 - 470.06 - 471.16 - 472.05 -473.39
🐻 🎯 - 464.90 - 463.61 - 462.01 - 460.97
Resistance at 20 SMMA

SPY - Nov. 10 - Price Action
Open: 465.58
High: 467.38
Low: 462.04
Close: 463.62
Volume: 65,876,478
SPY - Nov. 11 - Analysis
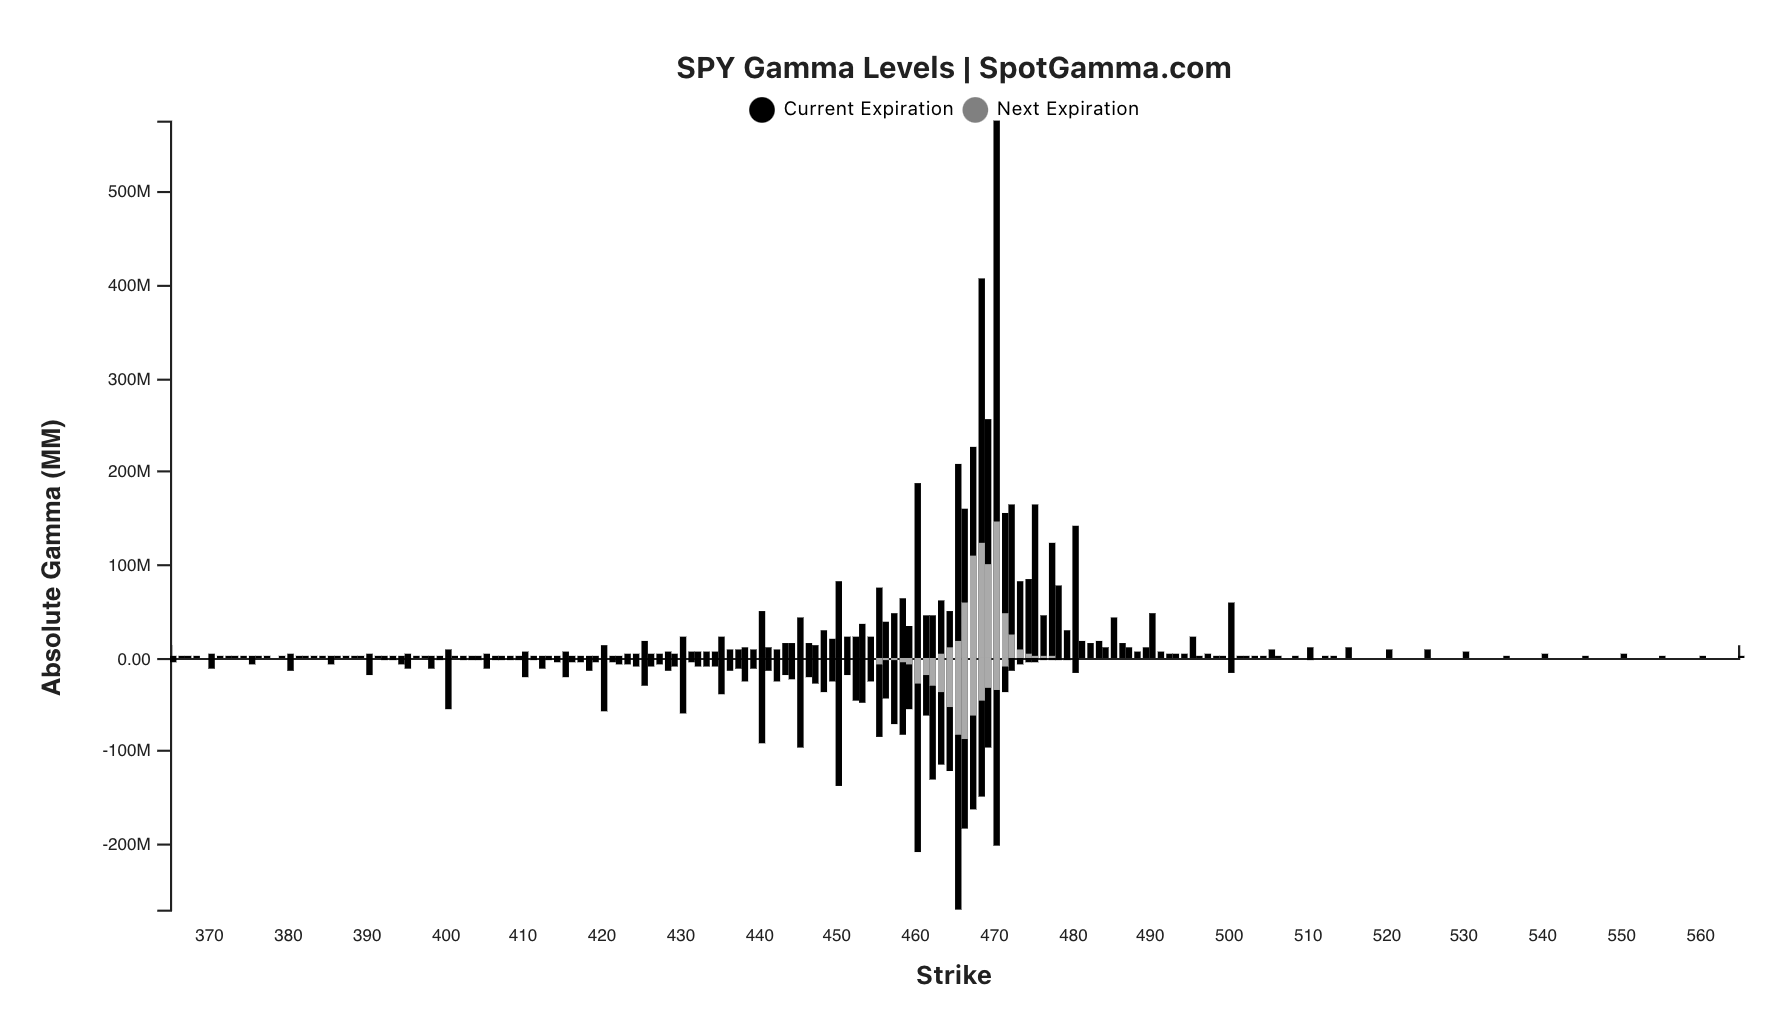
Options Data
Volume totals reflect options traded during the current session (10/10)
Put Volume Total: 2,568,118
Call Volume Total: 1,905,261
Put/Call Volume Ratio: 1.35
Put Open Interest Total: 13,409,498
Call Open Interest Total: 6,700,220
Put/Call Open Interest Ratio: 2.00

Technical Analysis - 65 min.
🔎 support - 462.04
Pivot - 463.93
🔎 resistance - 465.66
🐂 🎯 - 467.61 - 469.34 - 471.34
🐻 🎯 - 460.97 - 460.04 - 458.07 - 453.35
Resistance at 20 SMMA

RSI - 65 min.
Downtrend continued
Near oversold
Still room to run to Sept. and July lows
Bears in control

MACD - 65 min.
Continued downtrend

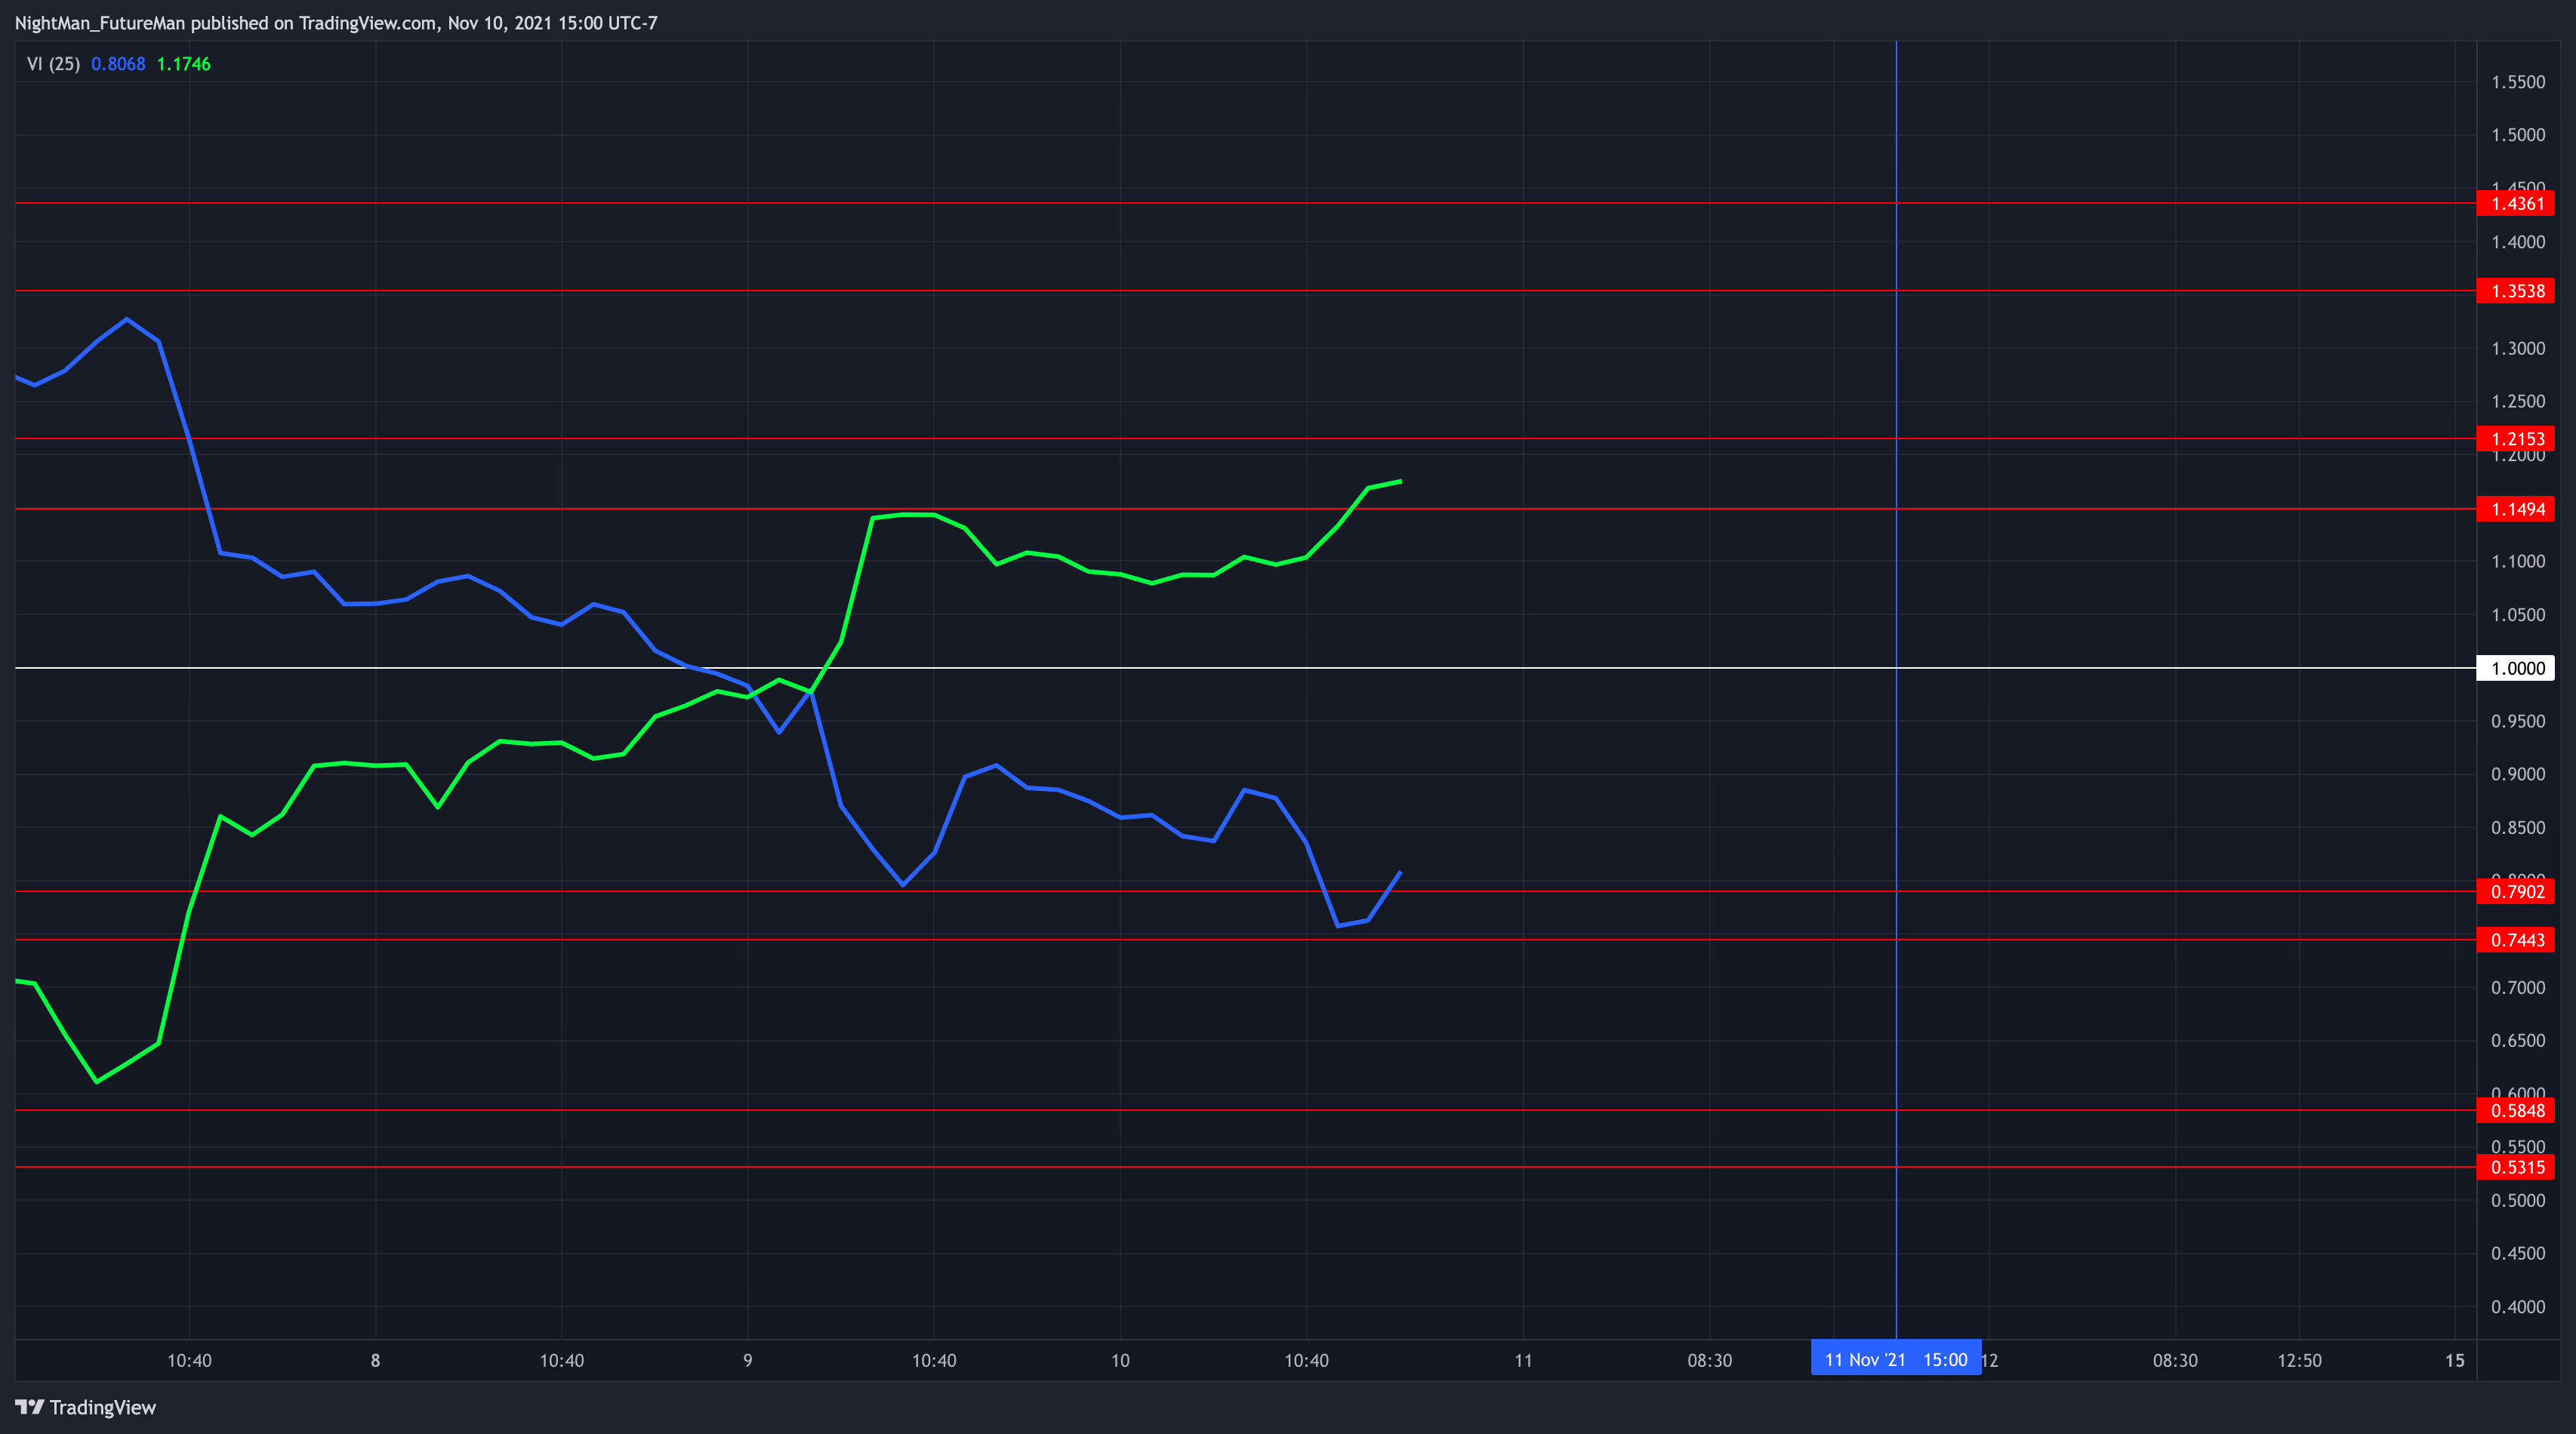
VI - 65 min.
Extended divergence
Still may not be bottom, still room to run
SPY Long-term Levels - 1 day
Look for major support 459.61 - 452.12, 447.21 gap fill

VIX - 65 min.
Completely filled gap
Watch for a retest of gap as support possibility
🐂🎯 - 20.87 - 24.00

Keep reading with a 7-day free trial
Subscribe to Follow the Trend to keep reading this post and get 7 days of free access to the full post archives.